0. 作品介紹
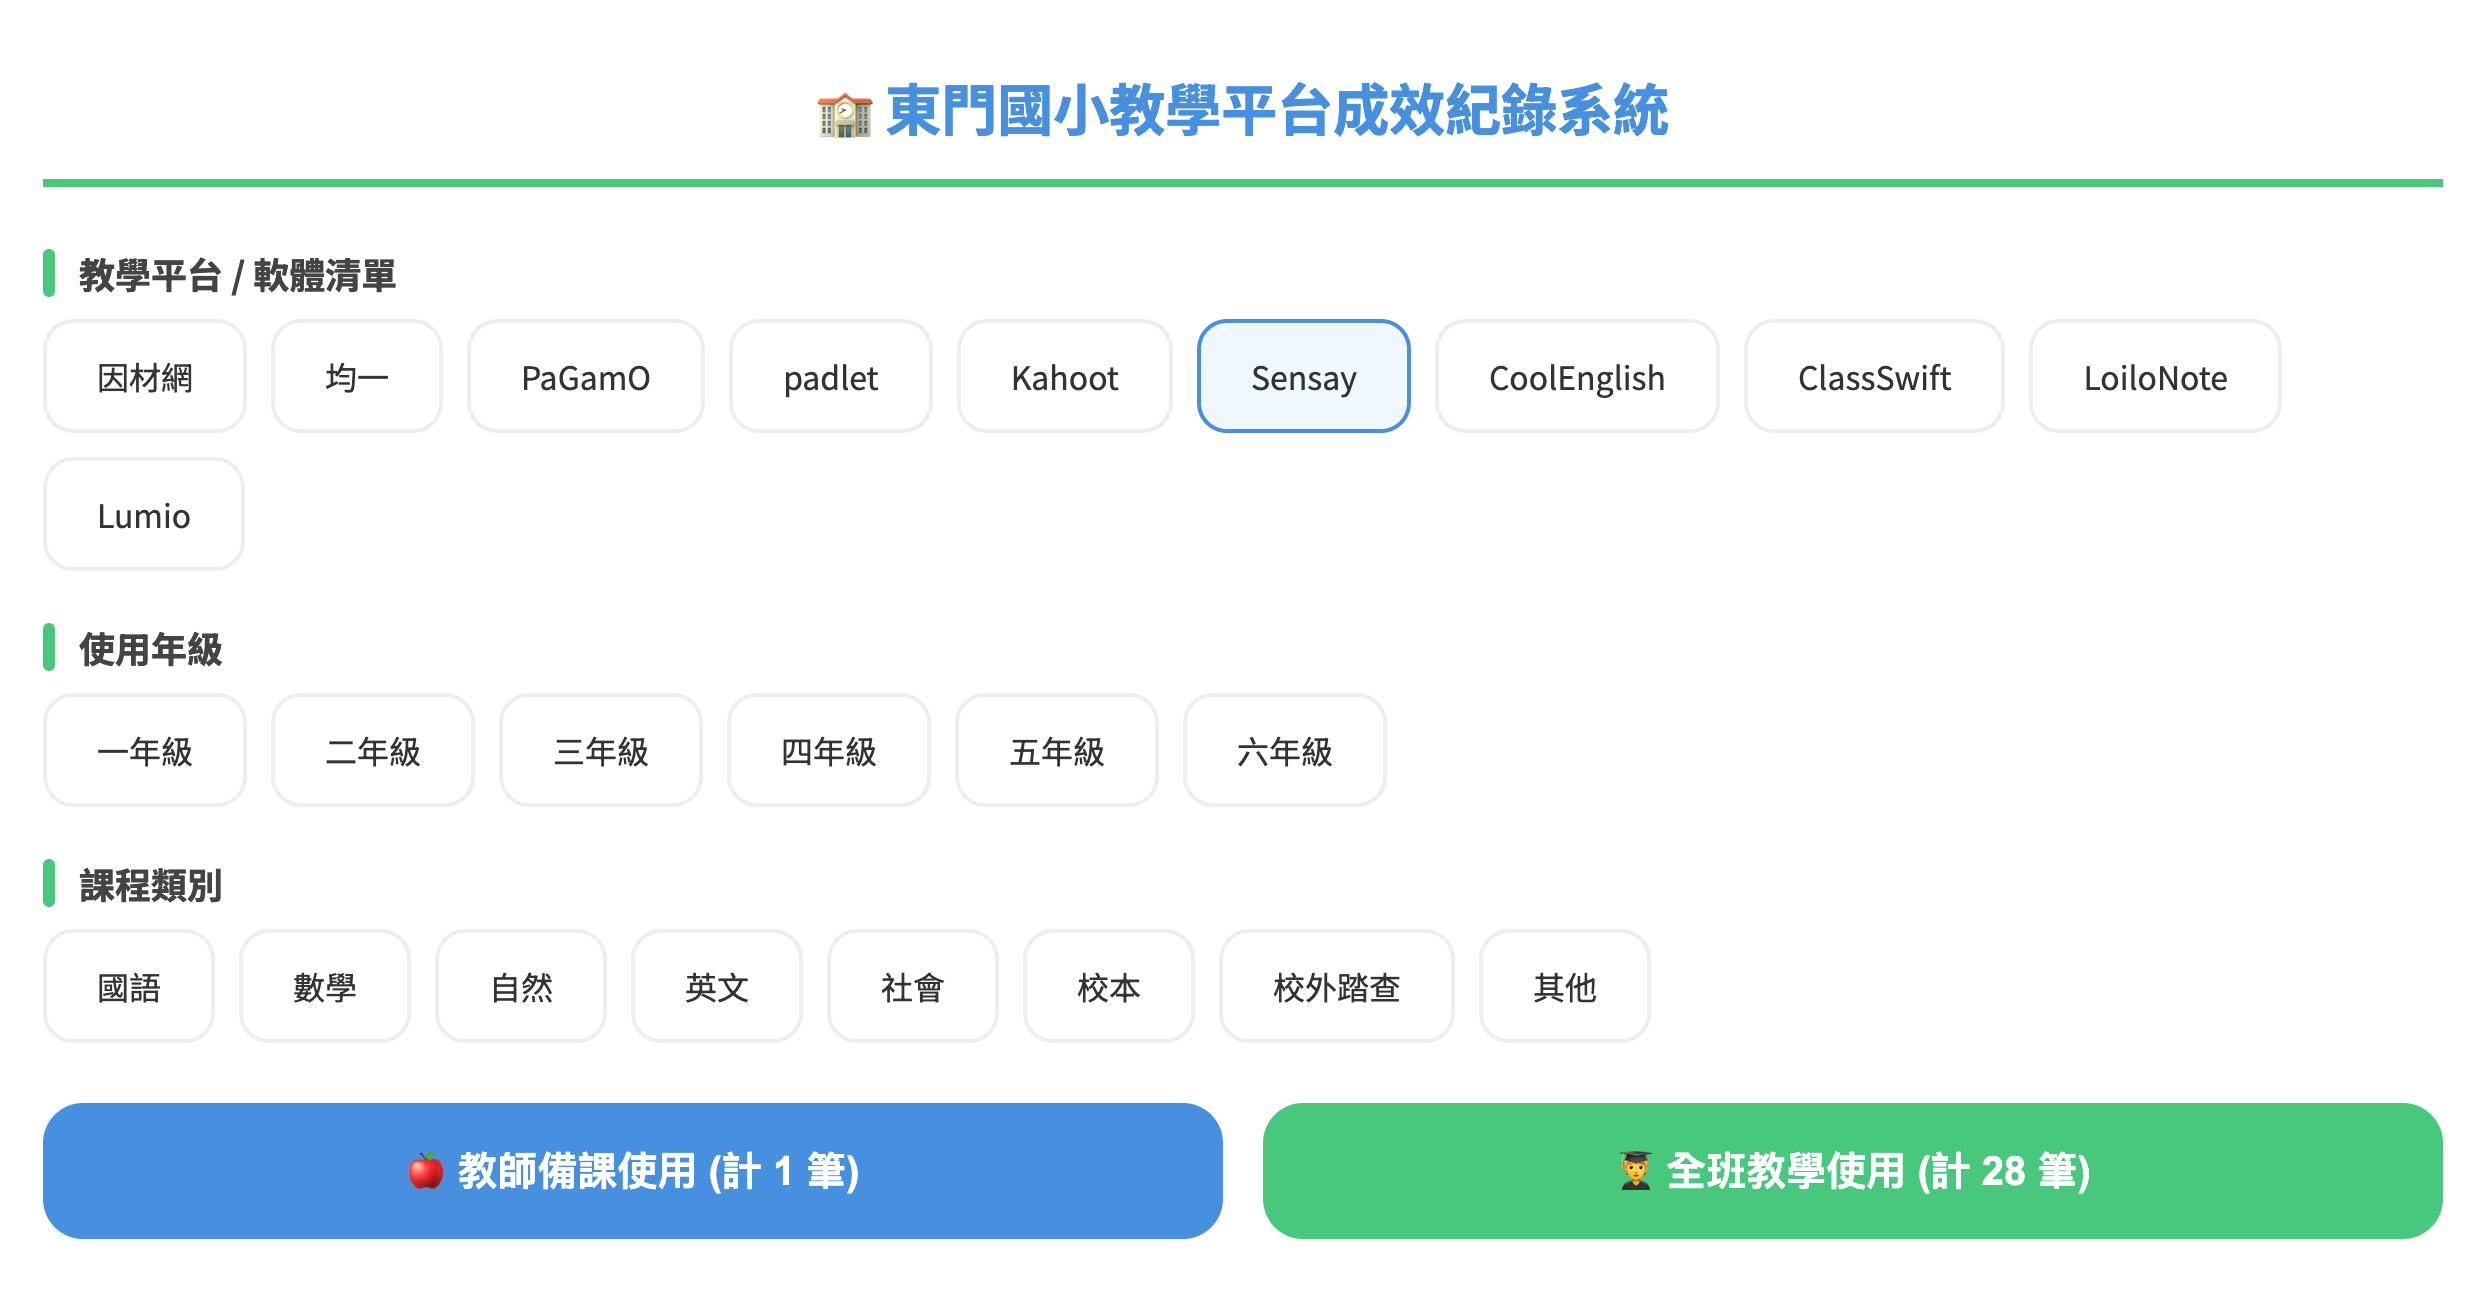 封面
封面
1. AI 提示詞
把這段指令貼給 AI,讓它幫你生成程式碼。
我想要建立一個 【東門國小校園教學平台、軟體使用成效紀錄系統】
幫我用Google 試算表建立 【資料庫】
我希望有些資料我可以直接在試算表更改首頁可以直接呈現
需求說明 【
校園教學平台有:因材網、均一、PaGamO
校園教學軟體有:padlet、Kahoot、Sensay、CoolEnglish、ClassSwift、LoiloNote
系統畫面以上下兩部分來呈現
上半部分為校園教學軟體、教學平台等清單,同時可以選取使用的年級(1-6年級)及使用的課程(如:國語、數學、自然、英文、社會、校本、校外踏查、其他),以上均以卡片形式顯示,要有送出的按鈕
下半部分為統計圖
每一個班級平均27人,所以老師點選一次,代表使用計次為28(1+27)
點選時可以判定日期、時間與節次:
08:00~08:40為早自習
08:40~09:20為第一節
09:30~10:10為第二節
10:30~11:10為第三節
11:20~12:00為第四節
12:00~13:30為午休
13:30~14:10為第五節
14:20~15:00為第六節
15:10~15:50為第七節
15:50~18:00為課後
統計圖分為兩個部份:左半部份為全部平台、軟體的使用計次統計圖,右半部份以周曆形式呈現,顯示每一個節有哪些軟體有班級使用
每一次老師點選,就代表一個班級使用了平台或軟體,統計圖就需要重新呈現
】
要把它變成程式碼我要發佈
請完整敘述操作步驟 越詳細越好
作業環境
Google試算表
Google Apps Script
我看不懂程式碼,請給我後端gs完整程式碼、前端index完整程式碼,
前端成畫面不要太陽春,我想要的風格為:校園、青春活潑、學術的氣息。
幫我用Google 試算表建立 【資料庫】
我希望有些資料我可以直接在試算表更改首頁可以直接呈現
需求說明 【
校園教學平台有:因材網、均一、PaGamO
校園教學軟體有:padlet、Kahoot、Sensay、CoolEnglish、ClassSwift、LoiloNote
系統畫面以上下兩部分來呈現
上半部分為校園教學軟體、教學平台等清單,同時可以選取使用的年級(1-6年級)及使用的課程(如:國語、數學、自然、英文、社會、校本、校外踏查、其他),以上均以卡片形式顯示,要有送出的按鈕
下半部分為統計圖
每一個班級平均27人,所以老師點選一次,代表使用計次為28(1+27)
點選時可以判定日期、時間與節次:
08:00~08:40為早自習
08:40~09:20為第一節
09:30~10:10為第二節
10:30~11:10為第三節
11:20~12:00為第四節
12:00~13:30為午休
13:30~14:10為第五節
14:20~15:00為第六節
15:10~15:50為第七節
15:50~18:00為課後
統計圖分為兩個部份:左半部份為全部平台、軟體的使用計次統計圖,右半部份以周曆形式呈現,顯示每一個節有哪些軟體有班級使用
每一次老師點選,就代表一個班級使用了平台或軟體,統計圖就需要重新呈現
】
要把它變成程式碼我要發佈
請完整敘述操作步驟 越詳細越好
作業環境
Google試算表
Google Apps Script
我看不懂程式碼,請給我後端gs完整程式碼、前端index完整程式碼,
前端成畫面不要太陽春,我想要的風格為:校園、青春活潑、學術的氣息。
2. 資料表規則
請照下面規則建立分頁與欄位。
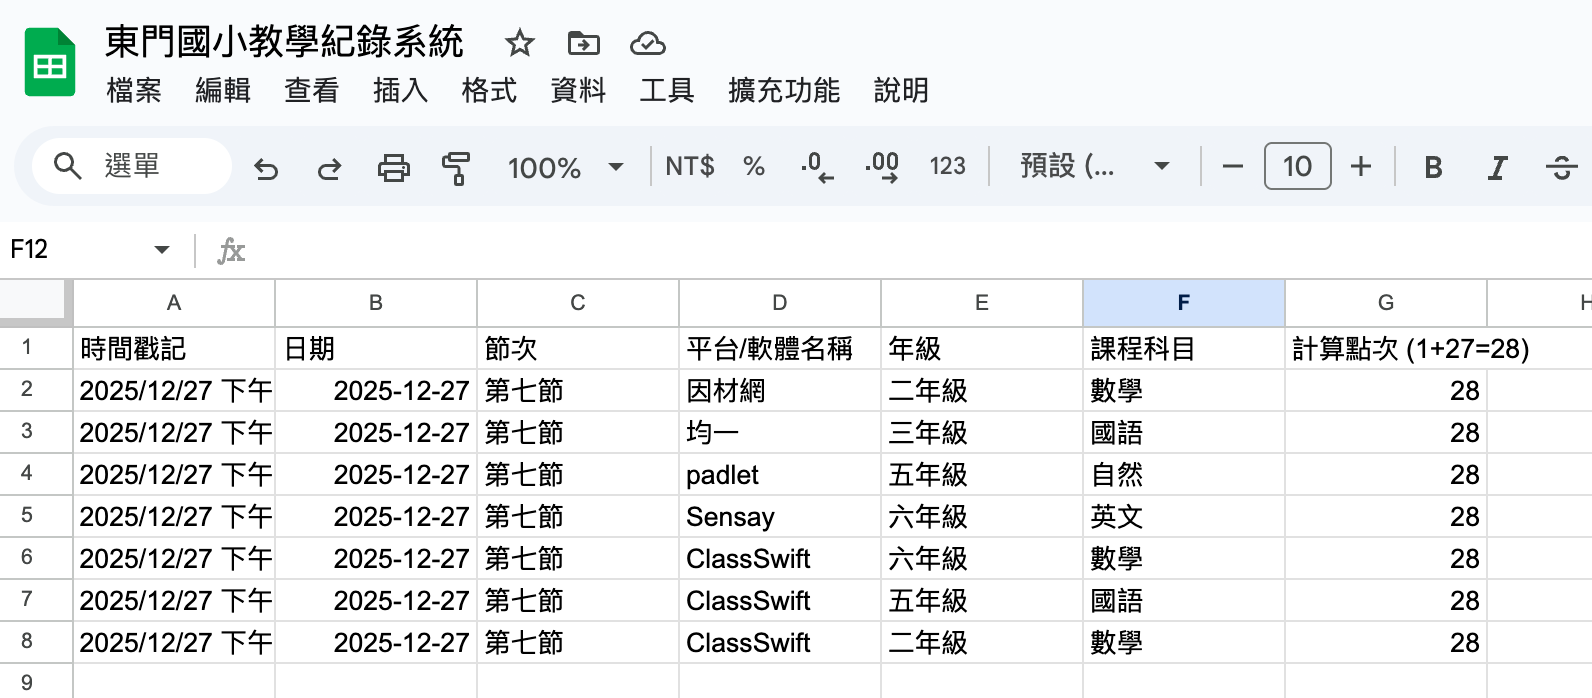
第1分頁: 使用紀錄
A 欄: 時間戳記
B 欄: 日期
C 欄: 節次
D 欄: 平台/軟體名稱
E 欄: 年級
F 欄: 課程科目
G 欄: 計算點次 (1+27=28)
📄 解析結果(自動表格)
分頁:使用紀錄
| A 欄 | B 欄 | C 欄 | D 欄 | E 欄 | F 欄 | G 欄 |
|---|---|---|---|---|---|---|
| 時間戳記 | 日期 | 節次 | 平台/軟體名稱 | 年級 | 課程科目 | 計算點次 (1+27=28) |
3. 開啟 Apps Script
從試算表開 Apps Script,才能直接用 SpreadsheetApp 讀寫資料。
- 試算表上方選單:擴充功能 → Apps Script
- 刪掉預設的程式碼(或全部選取覆蓋)
-
保留/建立檔案:
- Code.gs
- index.html
4. 貼上後端(Code.gs)
把後端程式貼到 Apps Script 的 Code.gs。
/**
 * 東門國小教學平台紀錄系統 - 雙按鈕計次版
 */

function doGet() {
  return HtmlService.createTemplateFromFile('index')
    .evaluate()
    .setTitle('東門國小教學平台成效系統')
    .addMetaTag('viewport', 'width=device-width, initial-scale=1')
    .setXFrameOptionsMode(HtmlService.XFrameOptionsMode.ALLOWALL);
}

// 取得動態選單資料
function getMenuData() {
  const ss = SpreadsheetApp.getActiveSpreadsheet();
  const sheet = ss.getSheetByName('系統選單');
  if (!sheet) return { tools: [], grades: [], subjects: [] };

  const data = sheet.getDataRange().getValues();
  const tools = [], grades = [], subjects = [];
  for (let i = 1; i < data.length; i++) {
    if (data[i][0]) tools.push(data[i][0]);
    if (data[i][1]) grades.push(data[i][1]);
    if (data[i][2]) subjects.push(data[i][2]);
  }
  return { tools, grades, subjects };
}

// 判定當前節次邏輯
function getCurrentSession() {
  const now = new Date();
  const time = now.getHours() * 100 + now.getMinutes();
  if (time >= 800 && time < 840) return "早自習";
  if (time >= 840 && time < 920) return "第一節";
  if (time >= 930 && time < 1010) return "第二節";
  if (time >= 1030 && time < 1110) return "第三節";
  if (time >= 1120 && time < 1200) return "第四節";
  if (time >= 1200 && time < 1330) return "午休";
  if (time >= 1330 && time < 1410) return "第五節";
  if (time >= 1420 && time < 1500) return "第六節";
  if (time >= 1510 && time < 1550) return "第七節";
  if (time >= 1550 && time < 1800) return "課後";
  return "非上課時間";
}

// 儲存資料 (新增 count 參數)
function submitRecord(data, count) {
  const ss = SpreadsheetApp.getActiveSpreadsheet();
  let sheet = ss.getSheetByName('使用紀錄');
  if (!sheet) {
    sheet = ss.insertSheet('使用紀錄');
    sheet.appendRow(["時間戳記", "日期", "節次", "平台軟體", "年級", "課程", "計次"]);
  }

  const now = new Date();
  const dateString = Utilities.formatDate(now, "GMT+8", "yyyy-MM-dd");
  const session = getCurrentSession();

  sheet.appendRow([now, dateString, session, data.tool, data.grade, data.subject, count]);
  return getStats(dateString);
}

// 取得統計資料
function getStats(targetDate) {
  const ss = SpreadsheetApp.getActiveSpreadsheet();
  const sheet = ss.getSheetByName('使用紀錄');
  const result = { totalStats: {}, dailyGrid: {}, targetDate: targetDate };

  if (!sheet) return result;
  const data = sheet.getDataRange().getValues();
  if (data.length <= 1) return result;

  for (let i = 1; i < data.length; i++) {
    let rowDateRaw = data[i][1];
    let rowDate = (rowDateRaw instanceof Date) ? Utilities.formatDate(rowDateRaw, "GMT+8", "yyyy-MM-dd") : String(rowDateRaw).trim();
    let session = data[i][2];
    let tool = data[i][3];
    let count = Number(data[i][6]) || 0;

    if (tool) result.totalStats[tool] = (result.totalStats[tool] || 0) + count;
    if (rowDate === targetDate) {
      if (!result.dailyGrid[session]) result.dailyGrid[session] = {};
      result.dailyGrid[session][tool] = (result.dailyGrid[session][tool] || 0) + 1;
    }
  }
  return result;
}
貼到 Apps Script 的 Code.gs 檔案
5. 貼上前端(index.html)
把前端程式貼到 Apps Script 的 index.html。
<!DOCTYPE html>
<html>
<head>
<base target="_top">
<link href="https://fonts.googleapis.com/css2?family=Noto+Sans+TC:wght@400;700&display=swap" rel="stylesheet">
<script src="https://cdn.jsdelivr.net/npm/chart.js"></script>
<style>
:root { --primary: #4A90E2; --secondary: #50C878; --bg: #F0F7FA; }
body { font-family: 'Noto Sans TC', sans-serif; background-color: var(--bg); margin: 0; padding: 20px; color: #333; }
.container { max-width: 1200px; margin: 0 auto; background: white; padding: 40px; border-radius: 30px; box-shadow: 0 10px 30px rgba(0,0,0,0.1); }
header { text-align: center; margin-bottom: 30px; border-bottom: 4px solid var(--secondary); padding-bottom: 15px; }
h1 { color: var(--primary); margin: 0; font-size: 28px; }
.section-title { font-weight: bold; margin: 25px 0 10px; color: #444; display: flex; align-items: center; font-size: 18px; }
.section-title::before { content: ""; width: 6px; height: 24px; background: var(--secondary); margin-right: 12px; border-radius: 5px; }
.card-group { display: flex; flex-wrap: wrap; gap: 12px; margin-bottom: 20px; min-height: 50px; }
.card { padding: 15px 25px; background: #fff; border: 2px solid #eee; border-radius: 15px; cursor: pointer; transition: 0.2s; font-weight: 500; }
.card:hover { border-color: var(--primary); background: #f0f7ff; }
.card.selected { background: var(--primary); color: white; border-color: var(--primary); transform: scale(1.05); box-shadow: 0 5px 15px rgba(74,144,226,0.3); }
/* 按鈕區域容器 */
.submit-area { display: flex; gap: 20px; margin-top: 30px; }
.btn { flex: 1; padding: 20px; border: none; border-radius: 20px; font-size: 20px; font-weight: bold; cursor: pointer; transition: 0.3s; color: white; }
.btn:disabled { background: #ccc !important; transform: none; cursor: not-allowed; }
.btn-teacher { background: var(--primary); }
.btn-teacher:hover { background: #357ABD; transform: translateY(-3px); box-shadow: 0 8px 20px rgba(74,144,226,0.4); }
.btn-class { background: var(--secondary); }
.btn-class:hover { background: #3dae63; transform: translateY(-3px); box-shadow: 0 8px 20px rgba(80,200,120,0.4); }
.dashboard { display: grid; grid-template-columns: 1.2fr 1fr; gap: 30px; margin-top: 50px; padding-top: 40px; border-top: 2px dashed #ddd; }
.chart-box { background: #fff; padding: 25px; border-radius: 25px; border: 1px solid #eee; min-height: 500px; }
.date-nav { display: flex; align-items: center; justify-content: center; gap: 20px; margin-bottom: 20px; background: #f8f9fa; padding: 10px; border-radius: 15px; }
.nav-btn { background: var(--primary); color: white; border: none; padding: 8px 18px; border-radius: 10px; cursor: pointer; font-weight: bold; }
#date-display { font-size: 18px; font-weight: bold; color: var(--primary); min-width: 140px; text-align: center; }
table { width: 100%; border-collapse: collapse; margin-top: 10px; }
th, td { border-bottom: 1px solid #eee; padding: 15px 10px; text-align: center; }
.tag { background: #E3F2FD; color: #1976D2; padding: 4px 10px; border-radius: 6px; margin: 3px; display: inline-block; font-size: 12px; font-weight: bold; }
</style>
</head>
<body>
<div class="container">
<header><h1>🏫 東門國小教學平台成效紀錄系統</h1></header>
<div class="section-title">教學平台 / 軟體清單</div>
<div class="card-group" id="menu-tools">載入中...</div>
<div class="section-title">使用年級</div>
<div class="card-group" id="menu-grades"></div>
<div class="section-title">課程類別</div>
<div class="card-group" id="menu-subjects"></div>
<div class="submit-area">
<button class="btn btn-teacher" id="btnT" onclick="doSubmit(1)">🍎 教師備課使用 (計 1 筆)</button>
<button class="btn btn-class" id="btnC" onclick="doSubmit(28)">🧑🎓 全班教學使用 (計 28 筆)</button>
</div>
<div class="dashboard">
<div class="chart-box">
<div class="section-title" style="justify-content:center;">全校軟體累計使用點次</div>
<div style="height: 450px;"><canvas id="myChart"></canvas></div>
</div>
<div class="chart-box">
<div class="date-nav">
<button class="nav-btn" onclick="moveDate(-1)">◀ 前一天</button>
<span id="date-display">...</span>
<button class="nav-btn" onclick="moveDate(1)">後一天 ▶</button>
</div>
<table id="sessionTable">
<thead><tr><th width="30%">節次</th><th>軟體使用明細</th></tr></thead>
<tbody id="sessionBody"></tbody>
</table>
</div>
</div>
</div>
<script>
let formData = { tool: '', grade: '', subject: '' };
let currentViewDate = new Date();
let chartInstance = null;
function initSystem() {
google.script.run.withSuccessHandler(function(menus) {
renderMenu('menu-tools', menus.tools, 'tool');
renderMenu('menu-grades', menus.grades, 'grade');
renderMenu('menu-subjects', menus.subjects, 'subject');
refreshStats();
}).getMenuData();
}
function renderMenu(containerId, list, type) {
const container = document.getElementById(containerId);
container.innerHTML = '';
list.forEach(item => {
const div = document.createElement('div');
div.className = 'card';
div.innerText = item;
div.onclick = function() {
container.querySelectorAll('.card').forEach(c => c.classList.remove('selected'));
div.classList.add('selected');
formData[type] = item;
};
container.appendChild(div);
});
}
function getFmtDate(d) {
const y = d.getFullYear();
const m = String(d.getMonth() + 1).padStart(2, '0');
const day = String(d.getDate()).padStart(2, '0');
return `${y}-${m}-${day}`;
}
function moveDate(offset) {
currentViewDate.setDate(currentViewDate.getDate() + offset);
refreshStats();
}
function refreshStats() {
const ds = getFmtDate(currentViewDate);
document.getElementById('date-display').innerText = ds;
google.script.run.withSuccessHandler(renderDashboard).getStats(ds);
}
// 修改後的送出邏輯,接收 count 參數
function doSubmit(count) {
if(!formData.tool || !formData.grade || !formData.subject) {
alert('請先選取所有欄位!'); return;
}
const btnT = document.getElementById('btnT');
const btnC = document.getElementById('btnC');
btnT.disabled = true; btnC.disabled = true;
google.script.run.withSuccessHandler(function(res) {
alert('紀錄成功!計次:' + count);
btnT.disabled = false; btnC.disabled = false;
currentViewDate = new Date();
renderDashboard(res);
document.querySelectorAll('.card').forEach(c => c.classList.remove('selected'));
formData = { tool: '', grade: '', subject: '' };
}).submitRecord(formData, count);
}
function renderDashboard(res) {
document.getElementById('date-display').innerText = res.targetDate;
const ctx = document.getElementById('myChart').getContext('2d');
if (chartInstance) chartInstance.destroy();
chartInstance = new Chart(ctx, {
type: 'bar',
data: {
labels: Object.keys(res.totalStats),
datasets: [{
label: '累計點次',
data: Object.values(res.totalStats),
backgroundColor: '#4A90E2cc',
borderRadius: 8
}]
},
options: { responsive: true, maintainAspectRatio: false }
});
const ss = ["早自習", "第一節", "第二節", "第三節", "第四節", "午休", "第五節", "第六節", "第七節", "課後"];
const tbody = document.getElementById('sessionBody');
tbody.innerHTML = '';
ss.forEach(s => {
let tags = '';
if(res.dailyGrid[s]) {
Object.keys(res.dailyGrid[s]).forEach(t => {
tags += `<span class="tag">${t} (${res.dailyGrid[s][t]}班)</span>`;
});
}
tbody.innerHTML += `<tr><td style="font-weight:bold; color:#555;">${s}</td><td style="text-align:left;">${tags || '<span style="color:#ddd">-</span>'}</td></tr>`;
});
}
window.onload = initSystem;
</script>
</body>
</html>貼到 Apps Script 的 index.html 檔案
6. 部署
部署成 Web App 後,就會拿到可分享網址。
- Apps Script 右上:部署 → 新部署
- 類型選:Web app
- 執行身分:你
- 存取權限:任何人
- 完成後複製網址
💬 評論區
老師們的交流與提問
登入 後即可發表評論